Map 01 · Global movement
Human Migration out of Africa
Elevation, routes, and settlement
Major migration paths set against global terrain and high-elevation settlements.
GIS · Cartography · Experience Design
Making relationships visible.
Selected work by Nolan Aleman-Eckhart across spatial storytelling, interactive design, and public learning.
Selected portfolio work
Selected Cartography
Open any image to see the full map, including its legend, scale, and source notes.
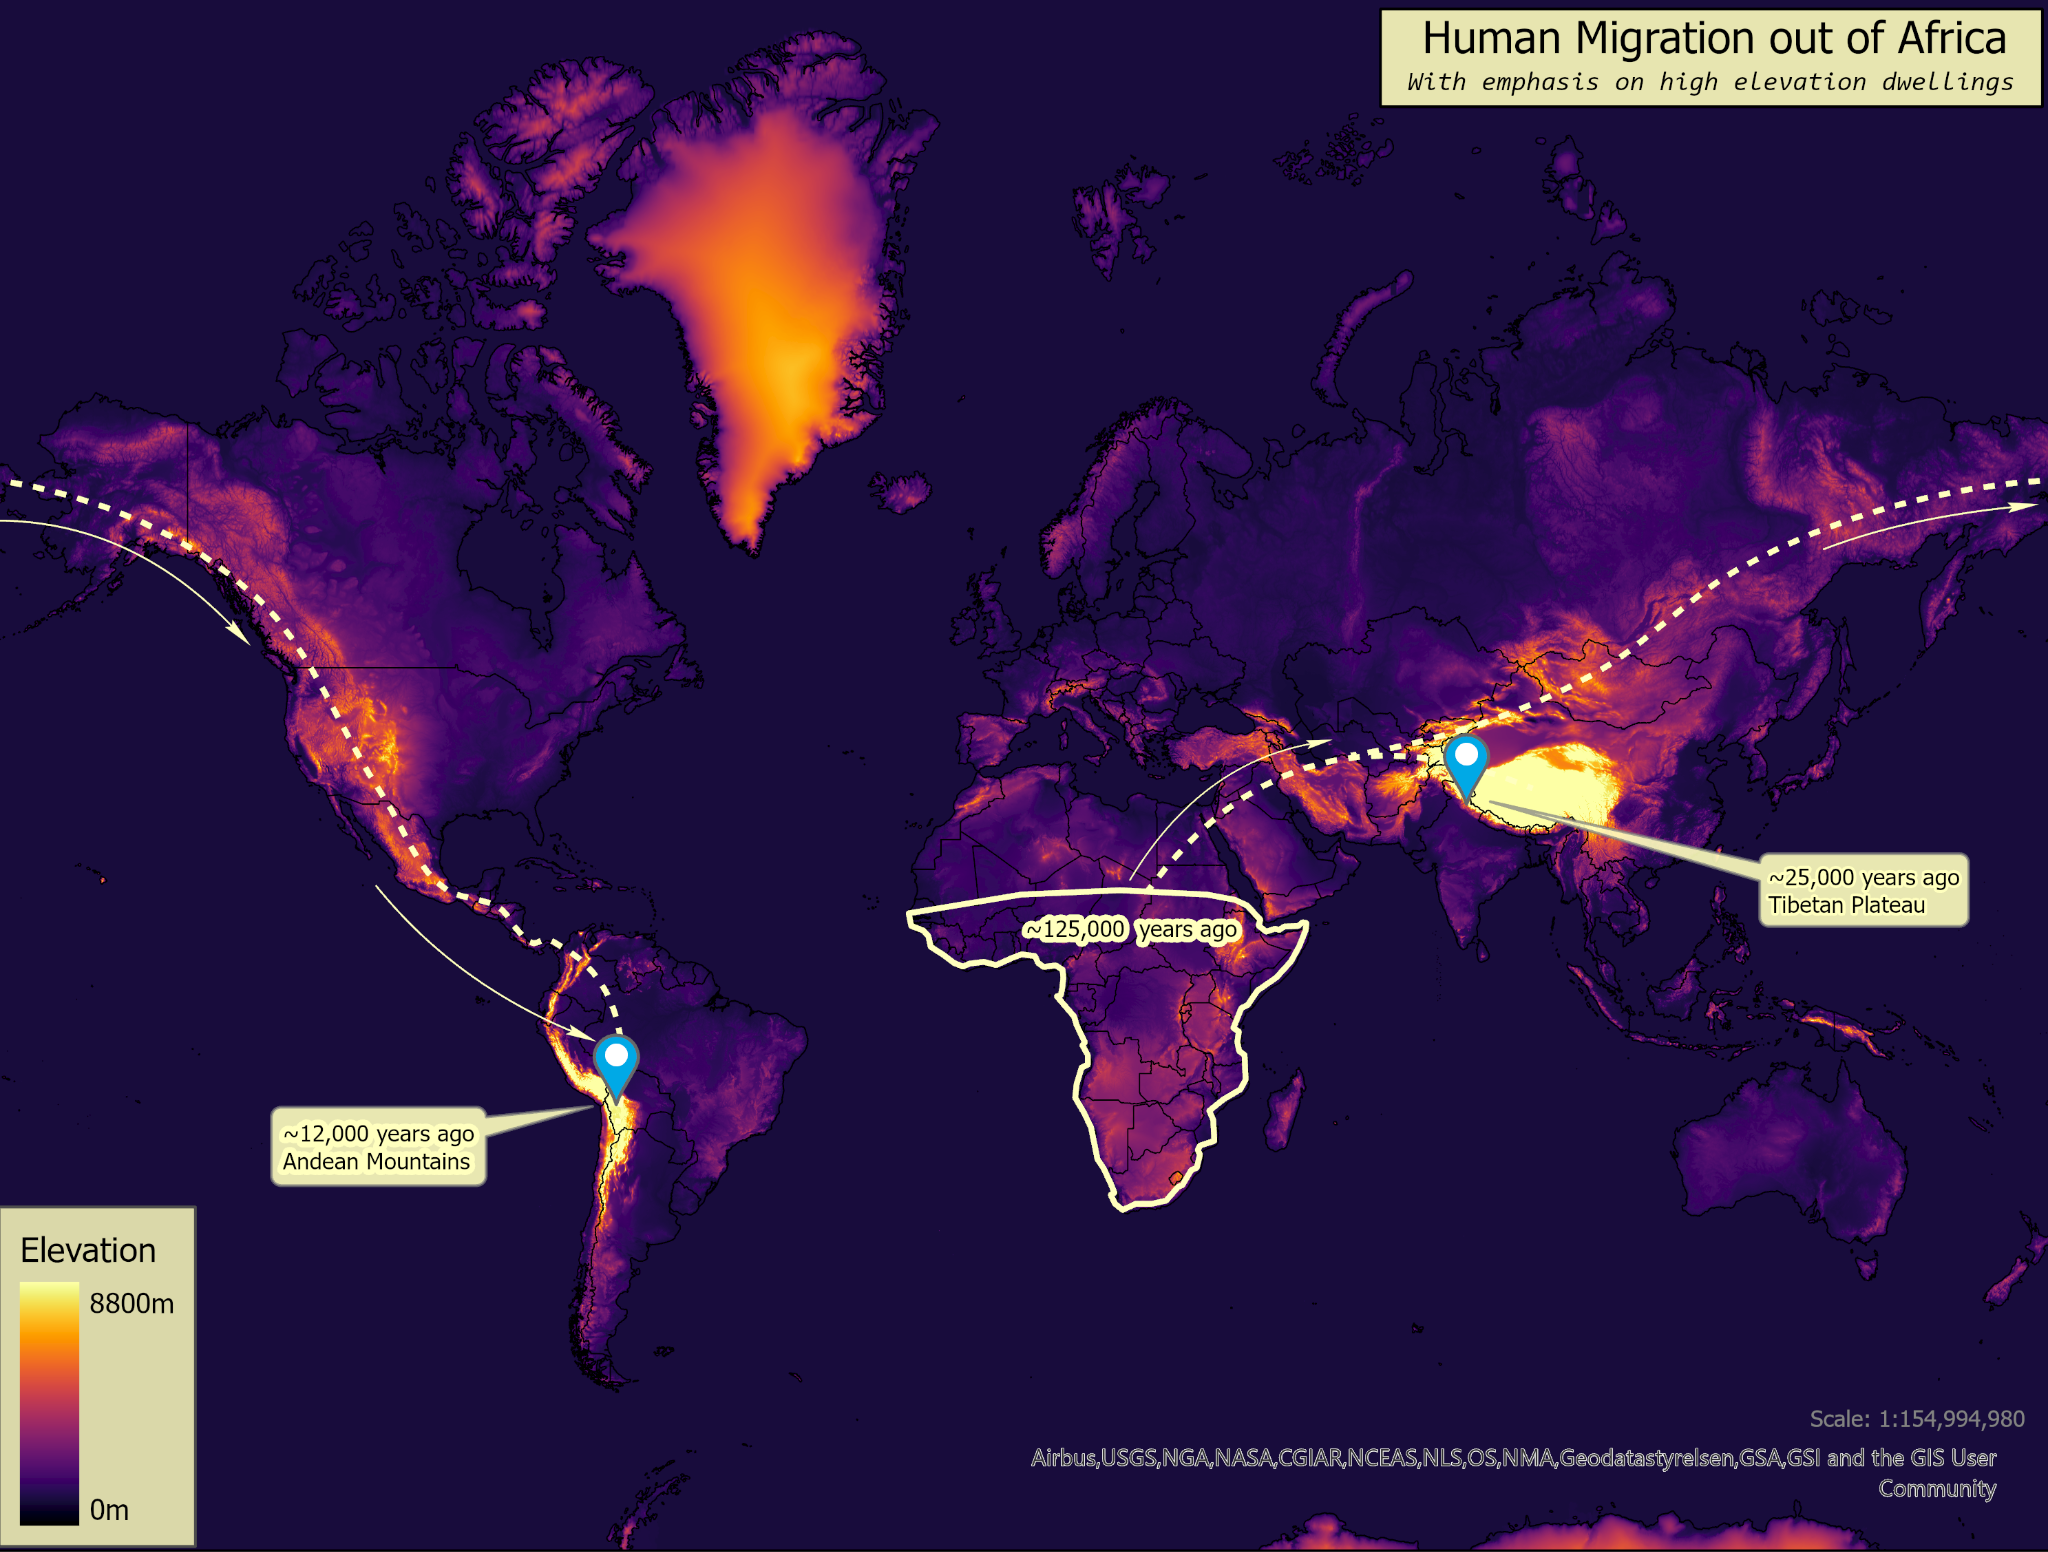
Map 01 · Global movement
Elevation, routes, and settlement
Major migration paths set against global terrain and high-elevation settlements.
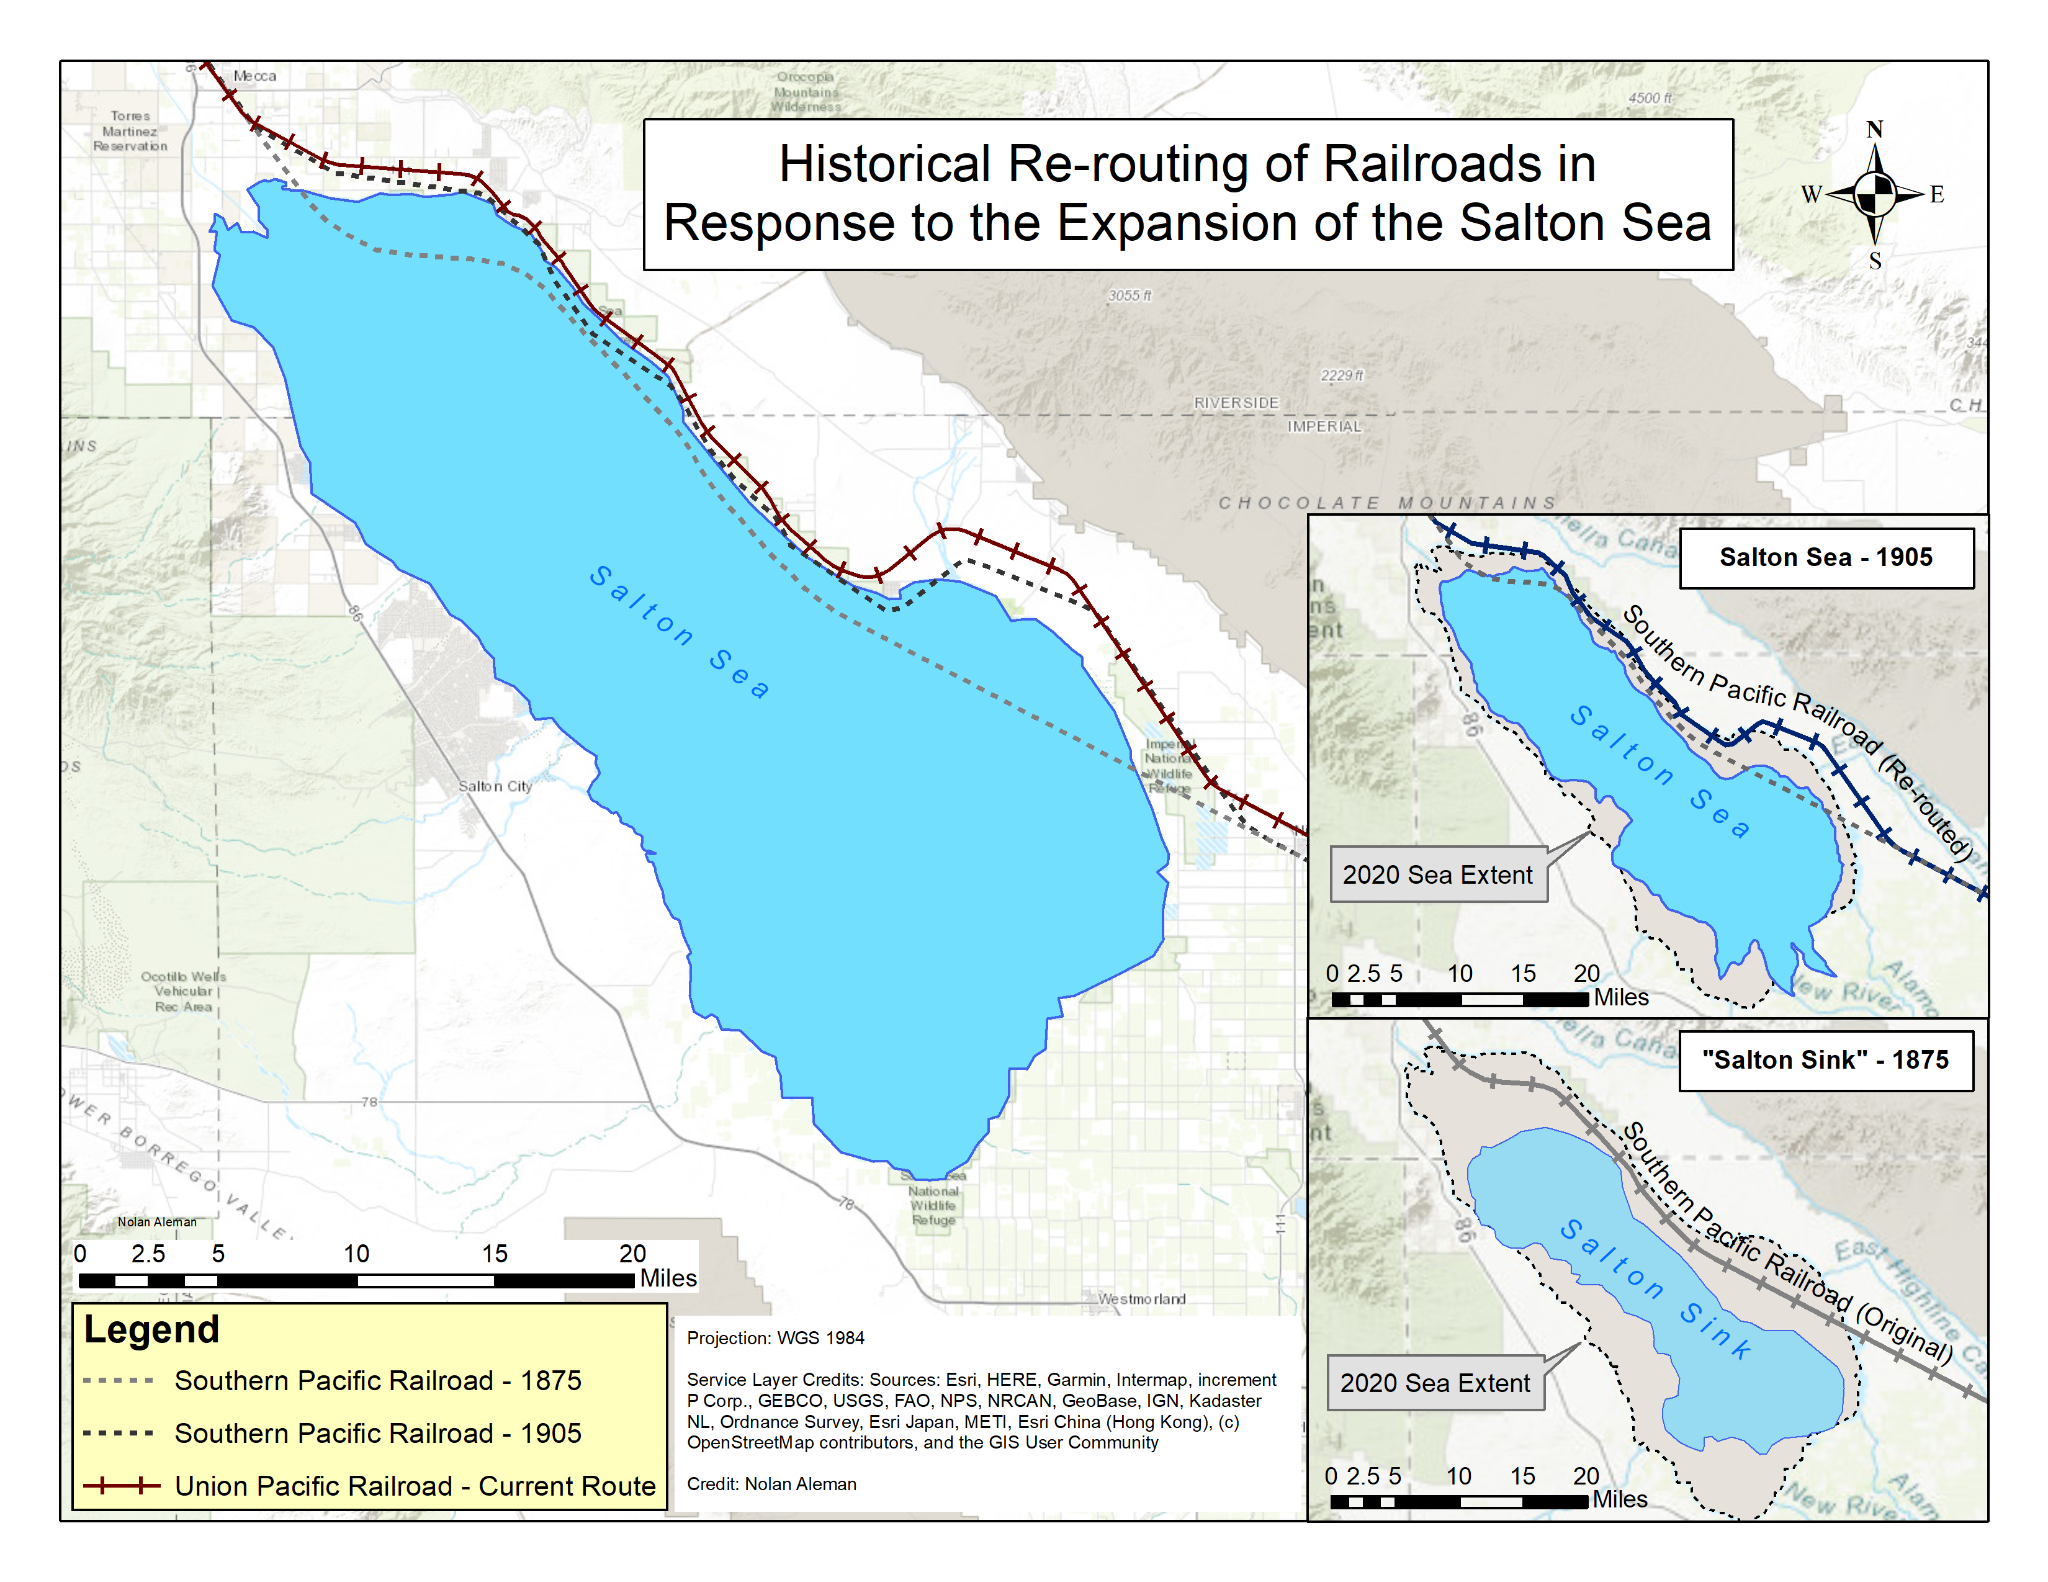
Map 02 · Historical change
1875, 1905, and the present
Three moments reveal how railroad routes shifted as the Salton Sea expanded.
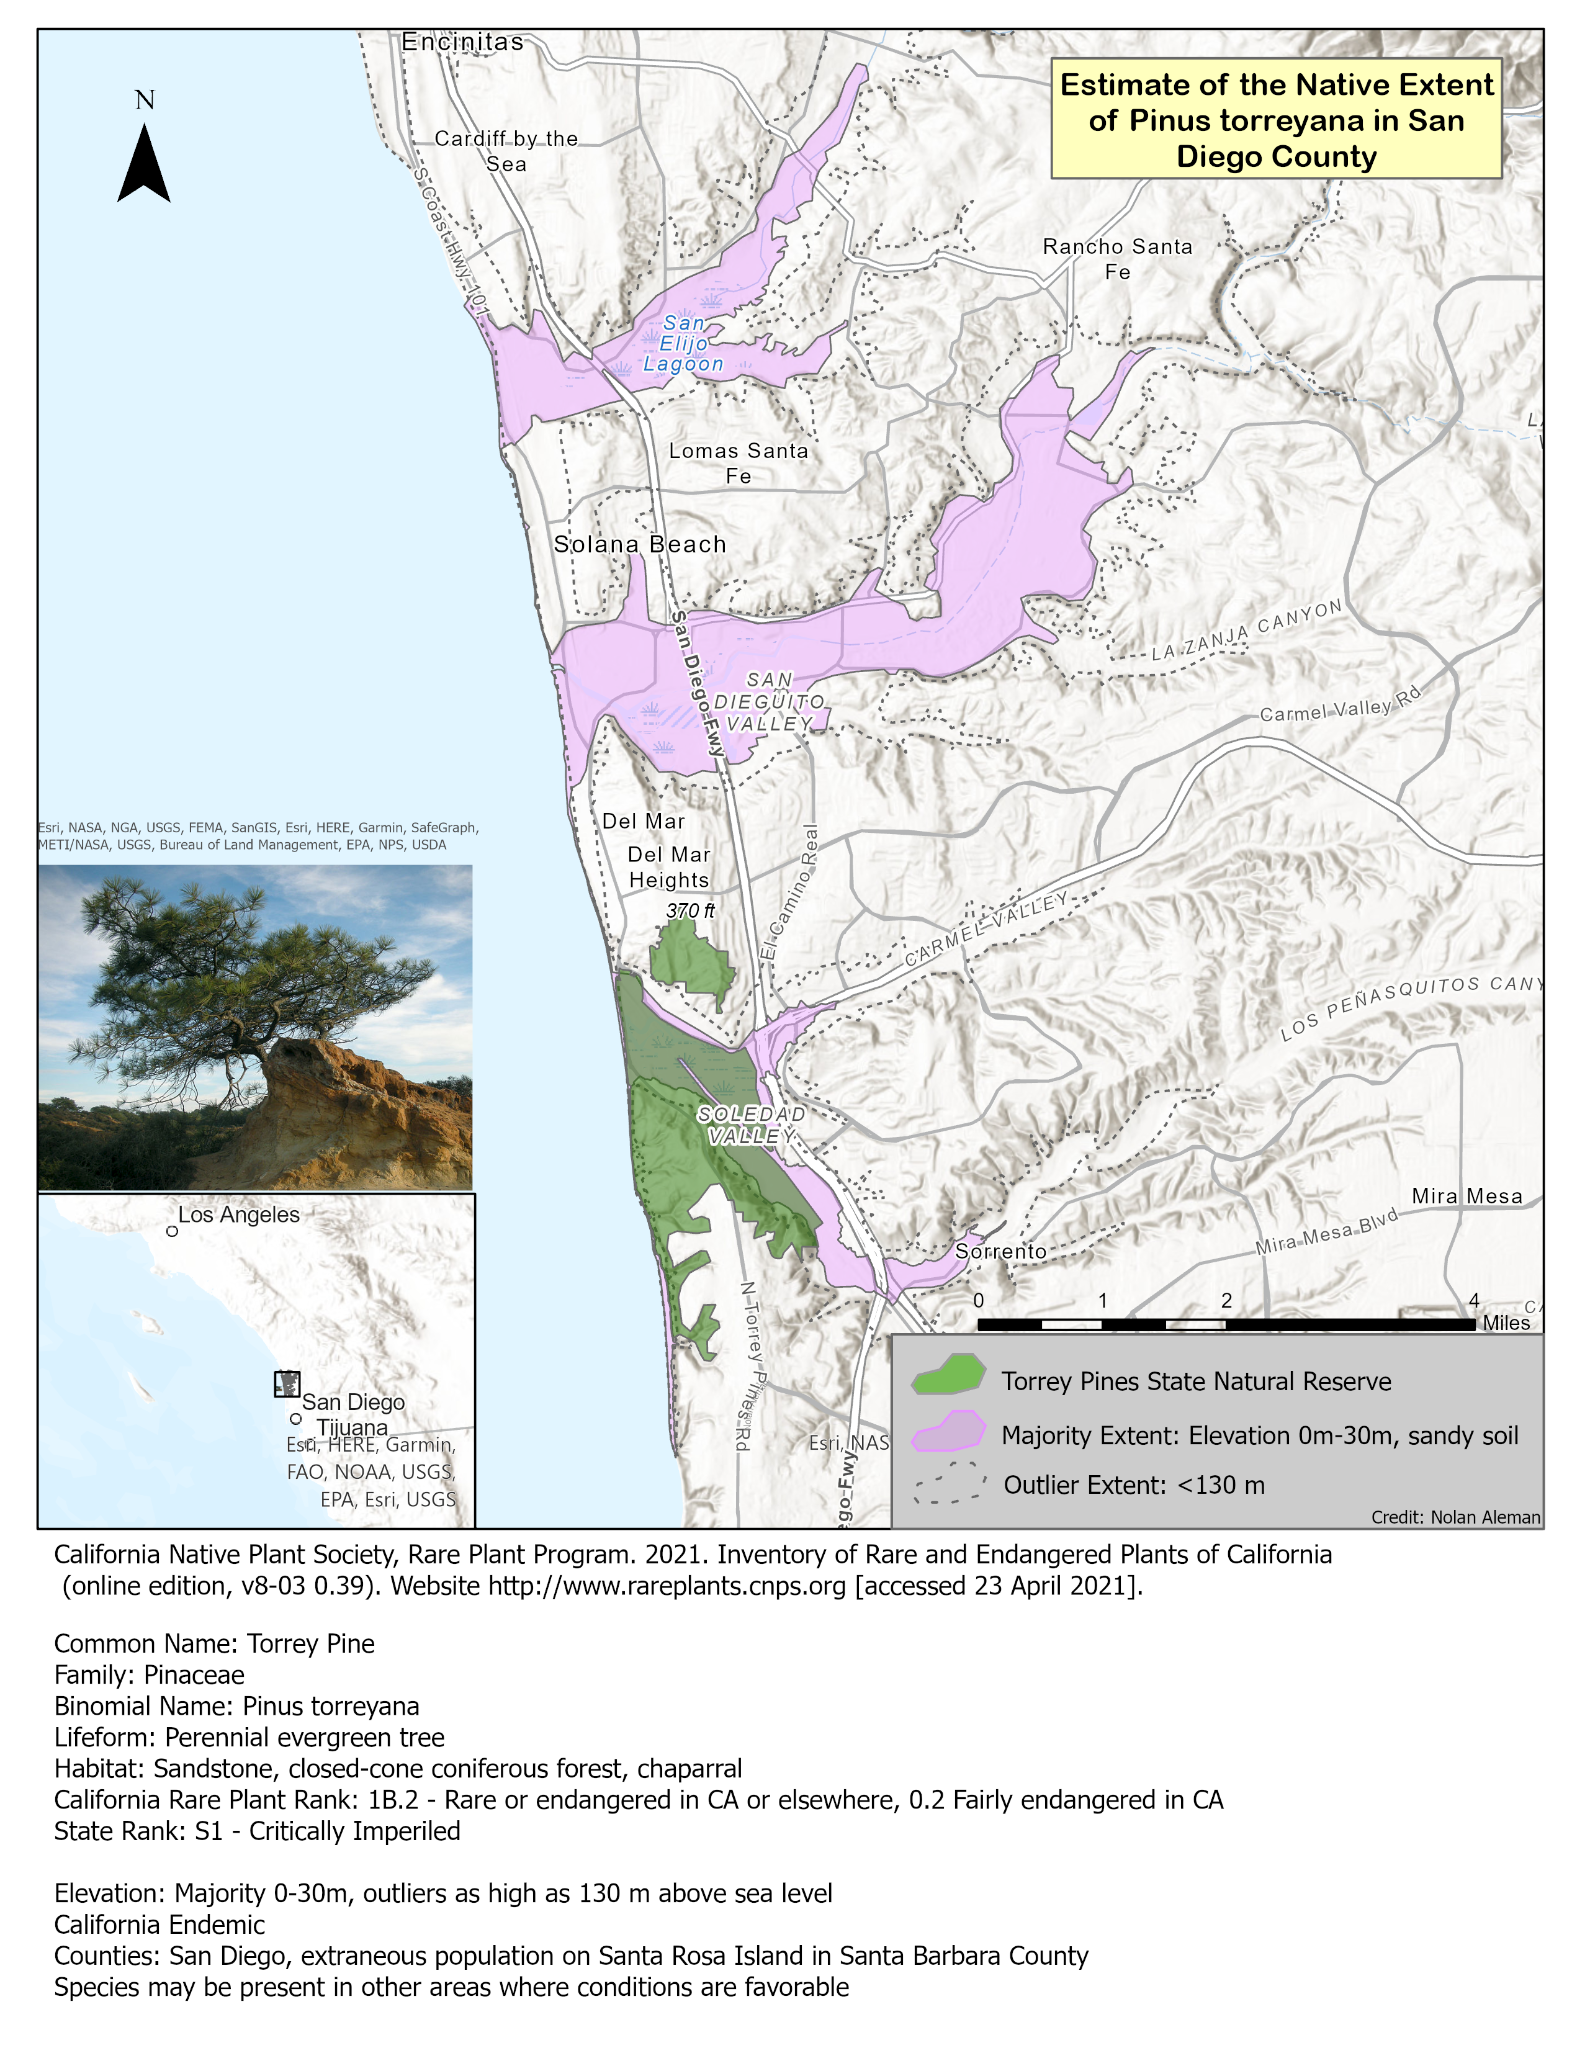
Map 03 · Habitat
Ecological criteria made spatial
Reserve boundaries, majority habitat, and outlier habitat shown in context.
More Cartography
Three additional views of connection, location, and agriculture.
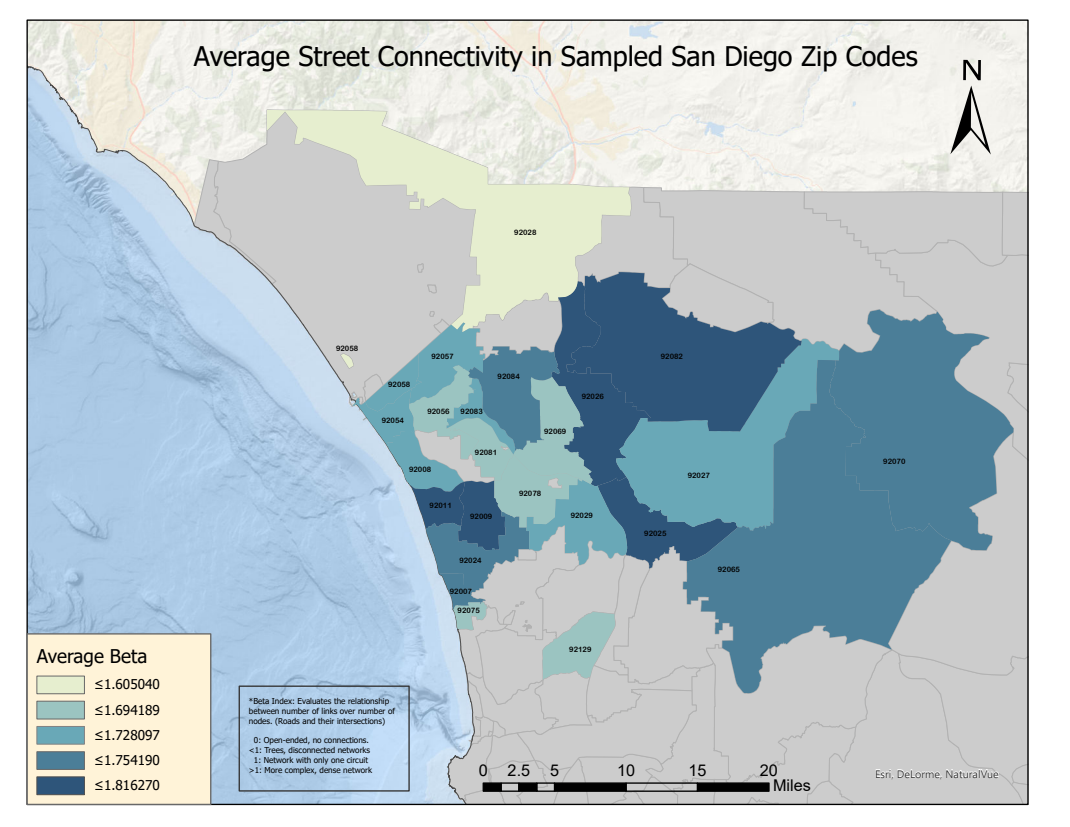
A beta-index comparison across sampled ZIP codes.
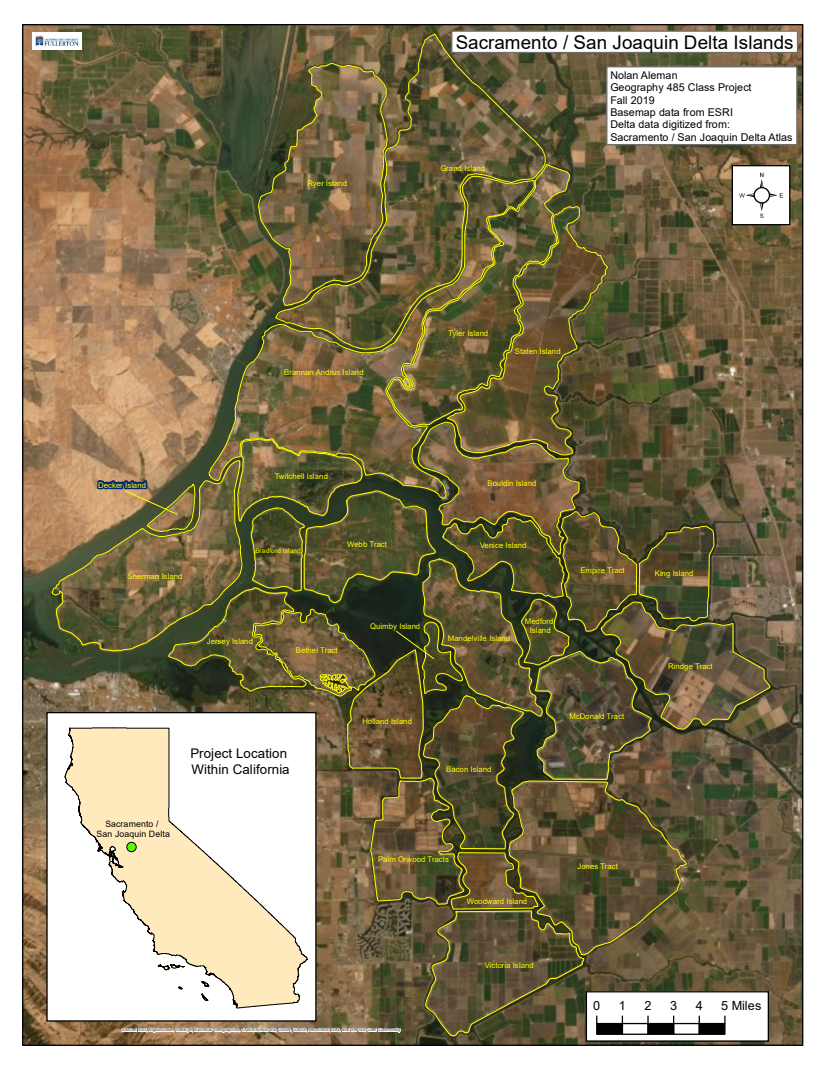
Satellite imagery and island boundaries establish the project area.
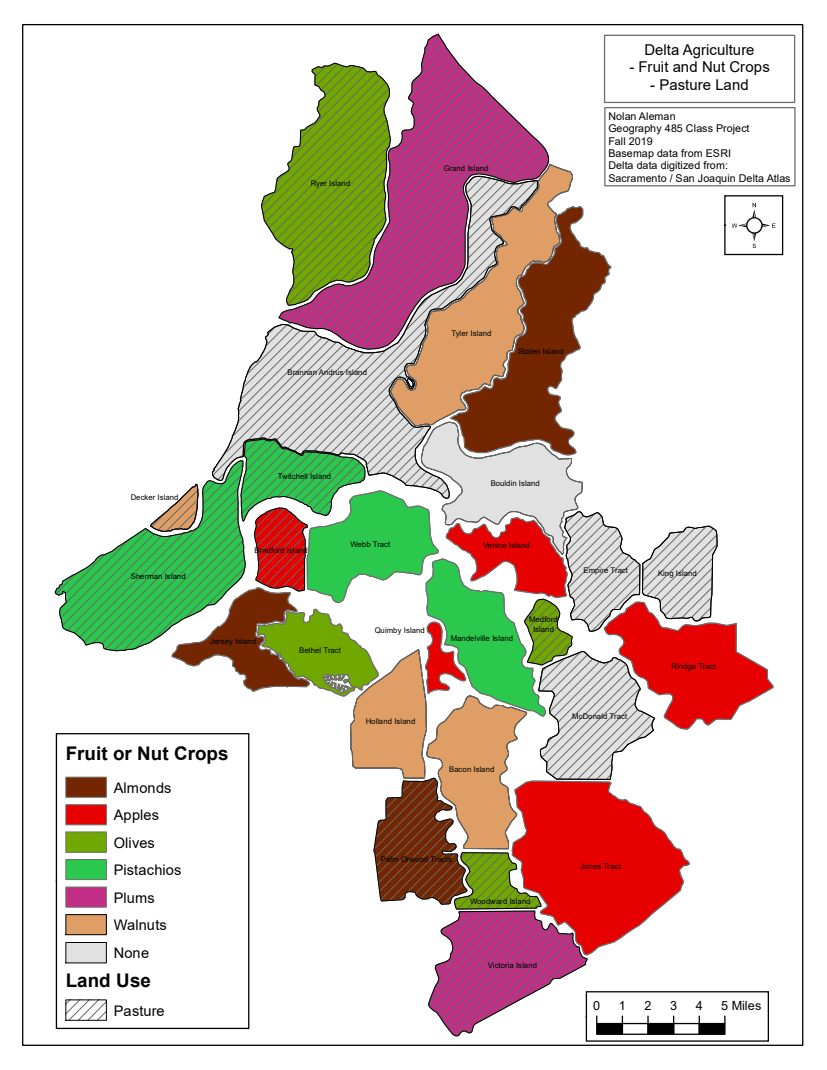
Fruit, nut crops, and pasture mapped across the same islands.
Interactive Tool
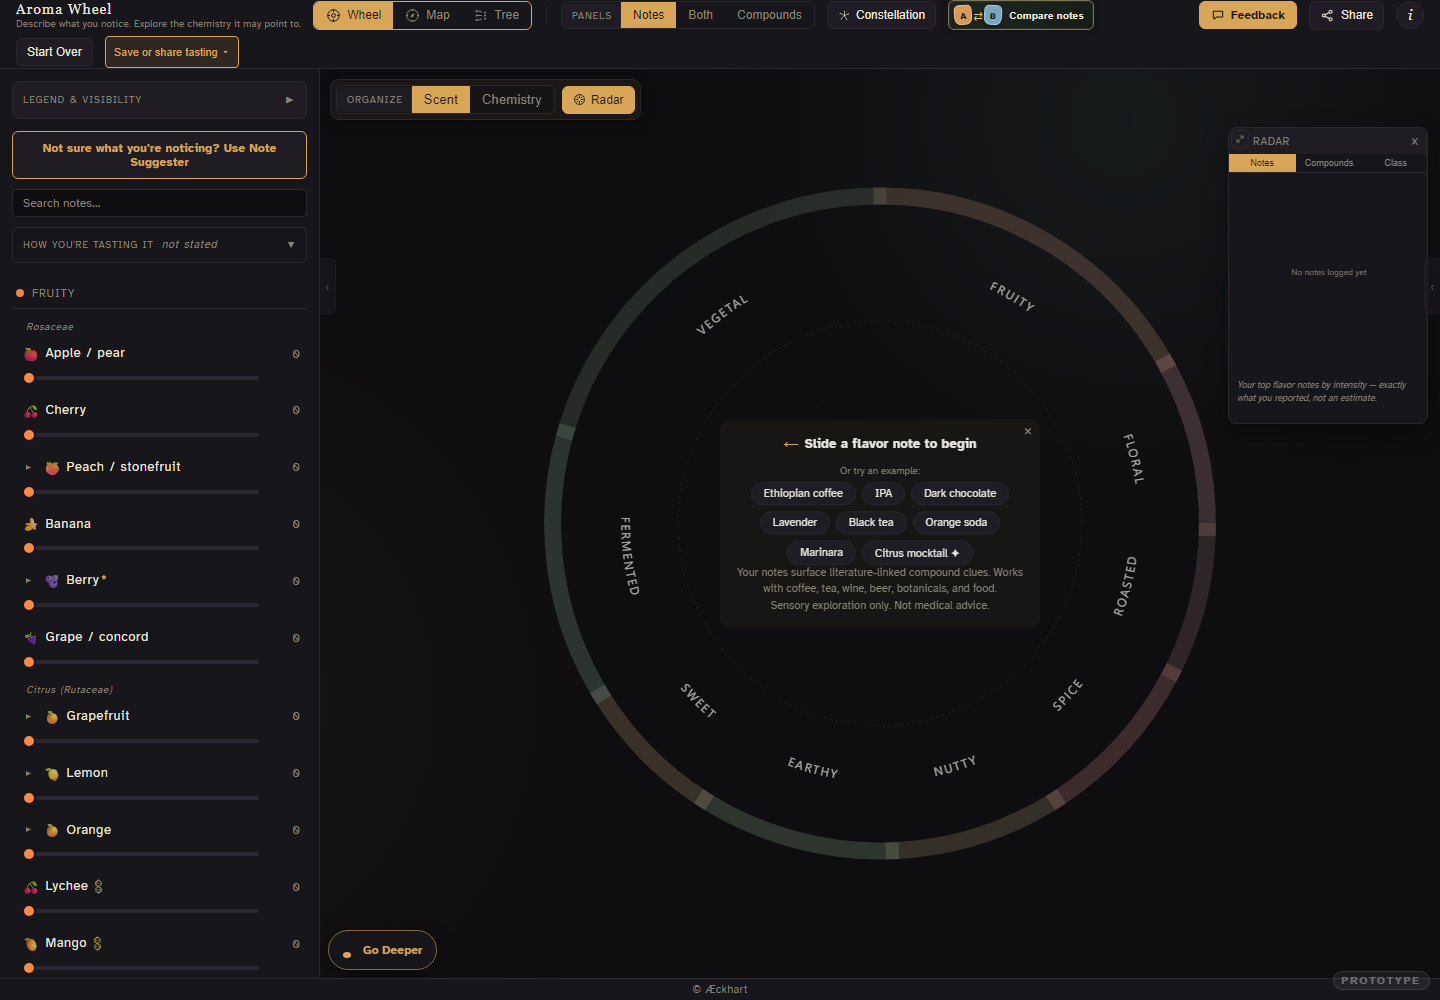
Record your aromatic experience and learn about the real compounds that create your sensory experience!
Sensory data · Interactive visualization
Move from the tasting wheel to Compare, Map, Tree, and Constellation views.
Interactive Visualization
Chess moves as island topography.
now lets design an html tool that will live on this site: a chess piece visualizer that uses topography to show valid moves from a piece with all current valid moves raised to the highest level, and all moves that are "next moves" a block lower , the lowest "land" pieces. All moves that are still without reach after even a next move should be "underwater" and show as blue under a softly rendered ocean. basically this is showing chess moves visuzlized as if it were islands coming out of the sea. use best language for visuzlizing and remember this will live on the site so try to make it lightweight. Also it's oklay to just show the moves possible forf that piece, not during a game. more like 9x9 to have that piece in the middle and showing its topographic islands of movement around it. Underwater really means - Unreachable. it should also be on the main site under aroma wheel.
Highlighted phrases are the parts of the draft that turned into visuals. Pick one and it lights up on the tool above.
About

Experience Designer working across cartography, interactive tools, and public learning.